Linux Security Without Endpoint Agents
Trusted on critical infrastructure globally, Sandfly delivers agentless Linux security with no endpoint agents and no drama.
Learn more →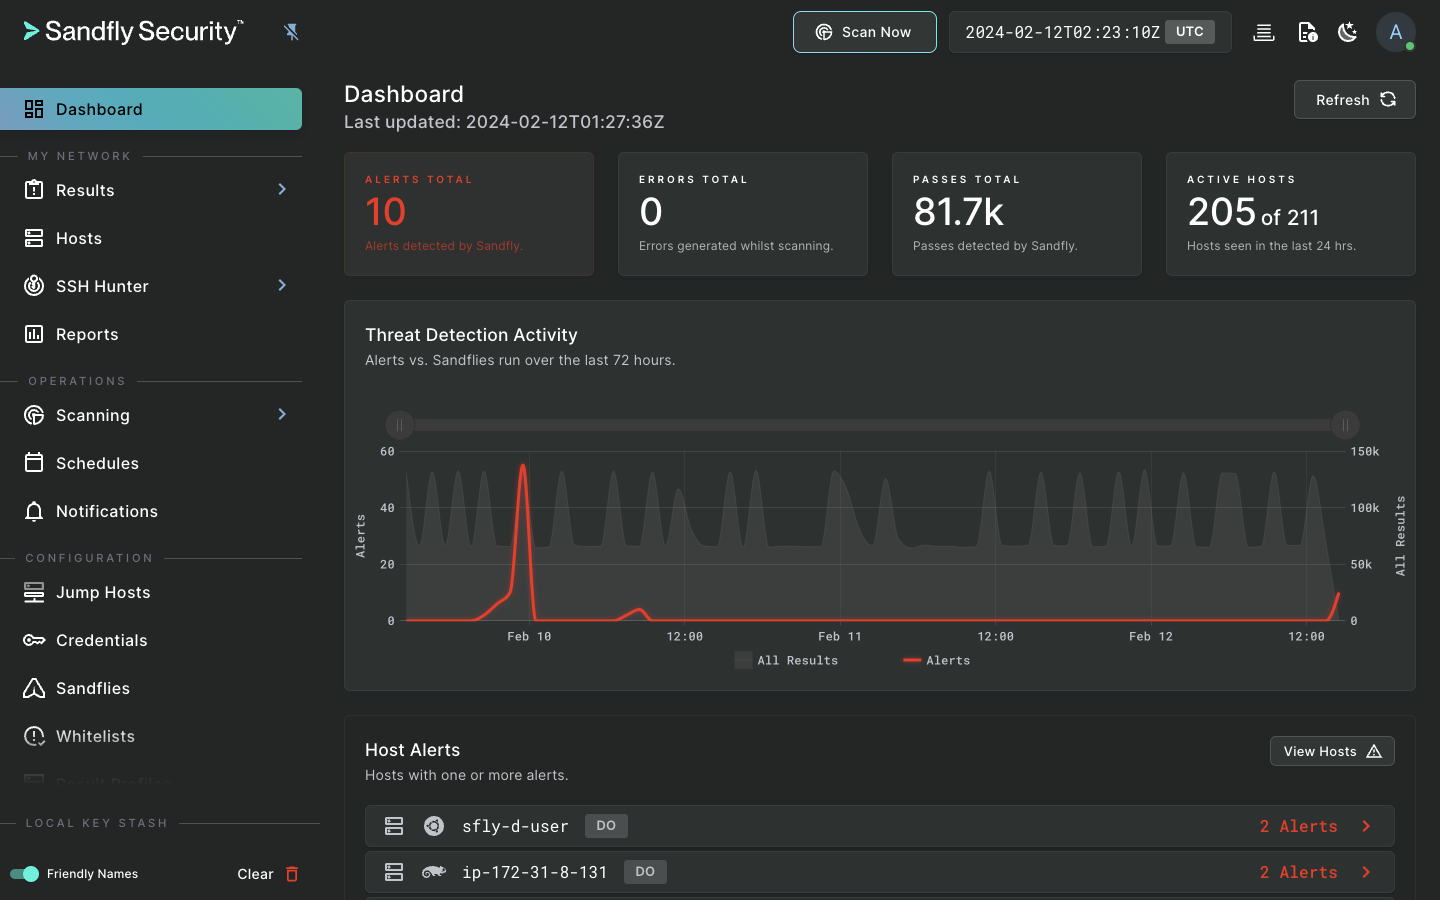
Trusted on Critical Infrastructure
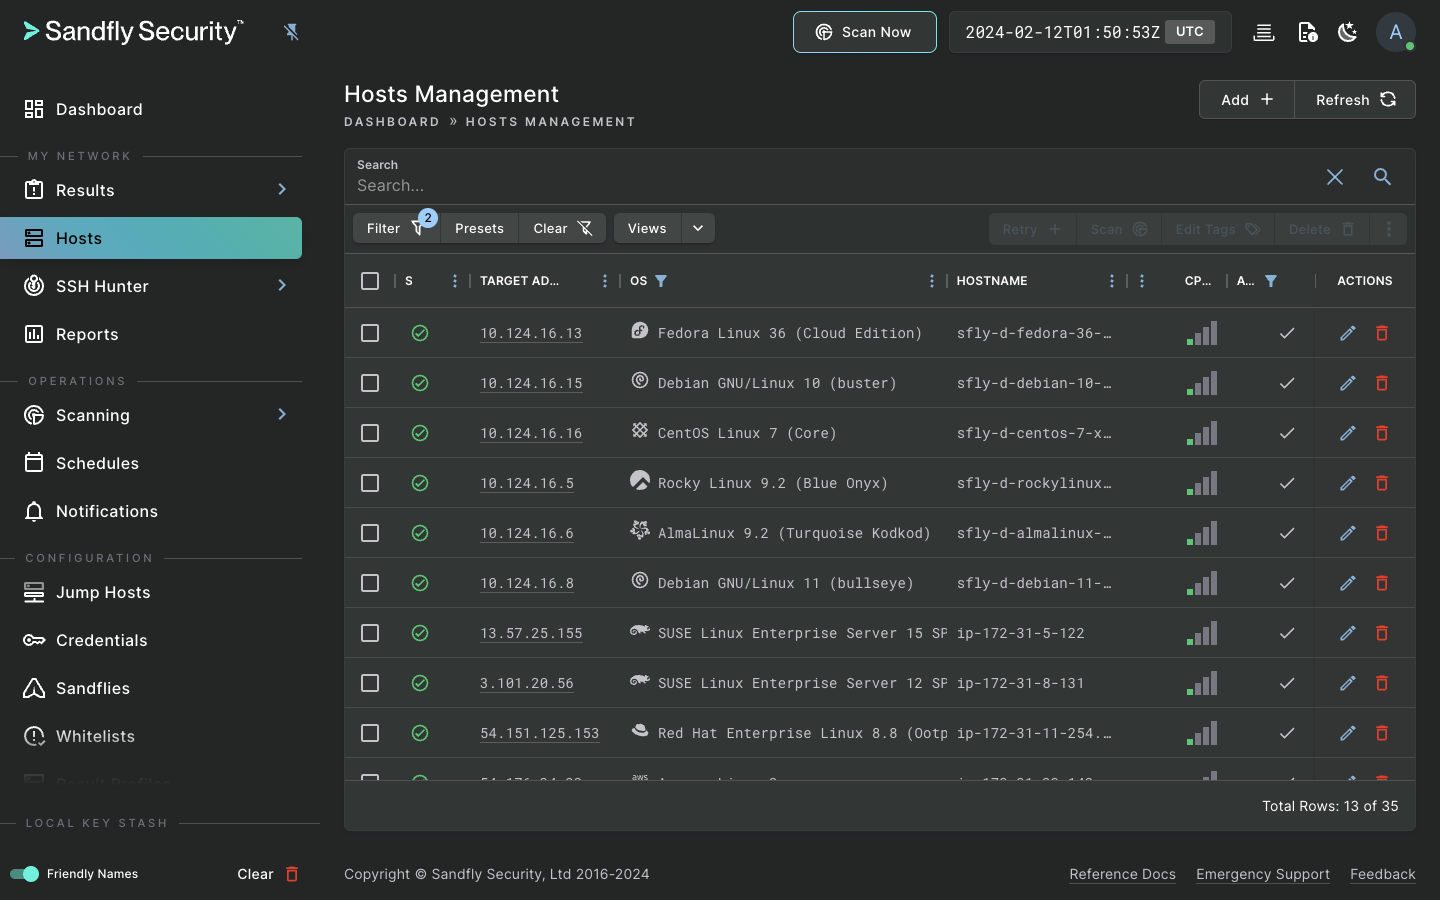
Sandfly is an agentless, instantly deployable, and safe Linux security monitoring platform. Sandfly protects virtually any Linux system, from modern cloud deployments to decade-old devices, regardless of distribution or CPU architecture.
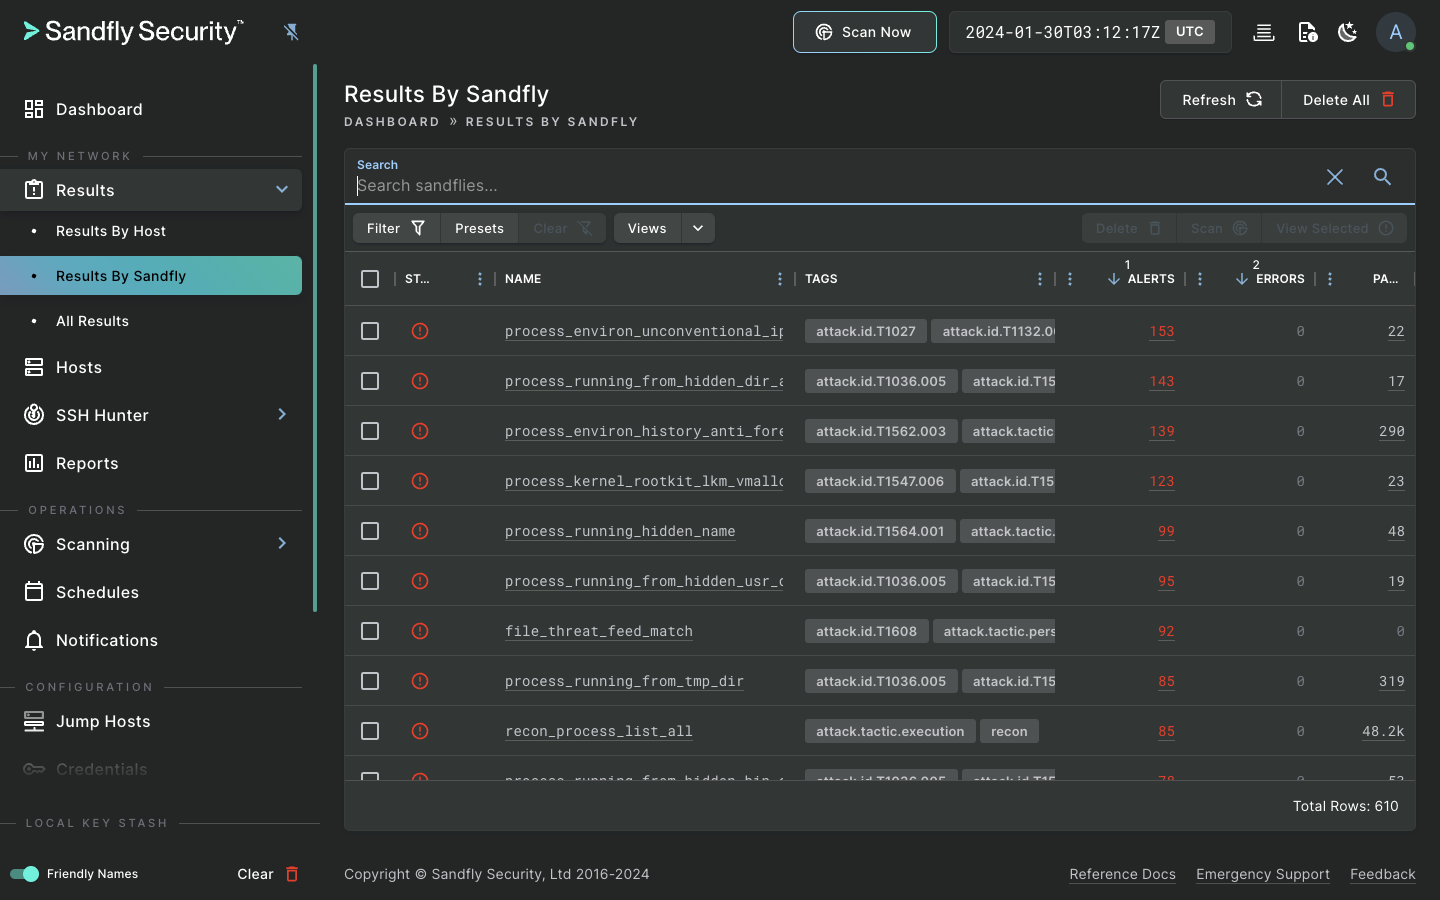
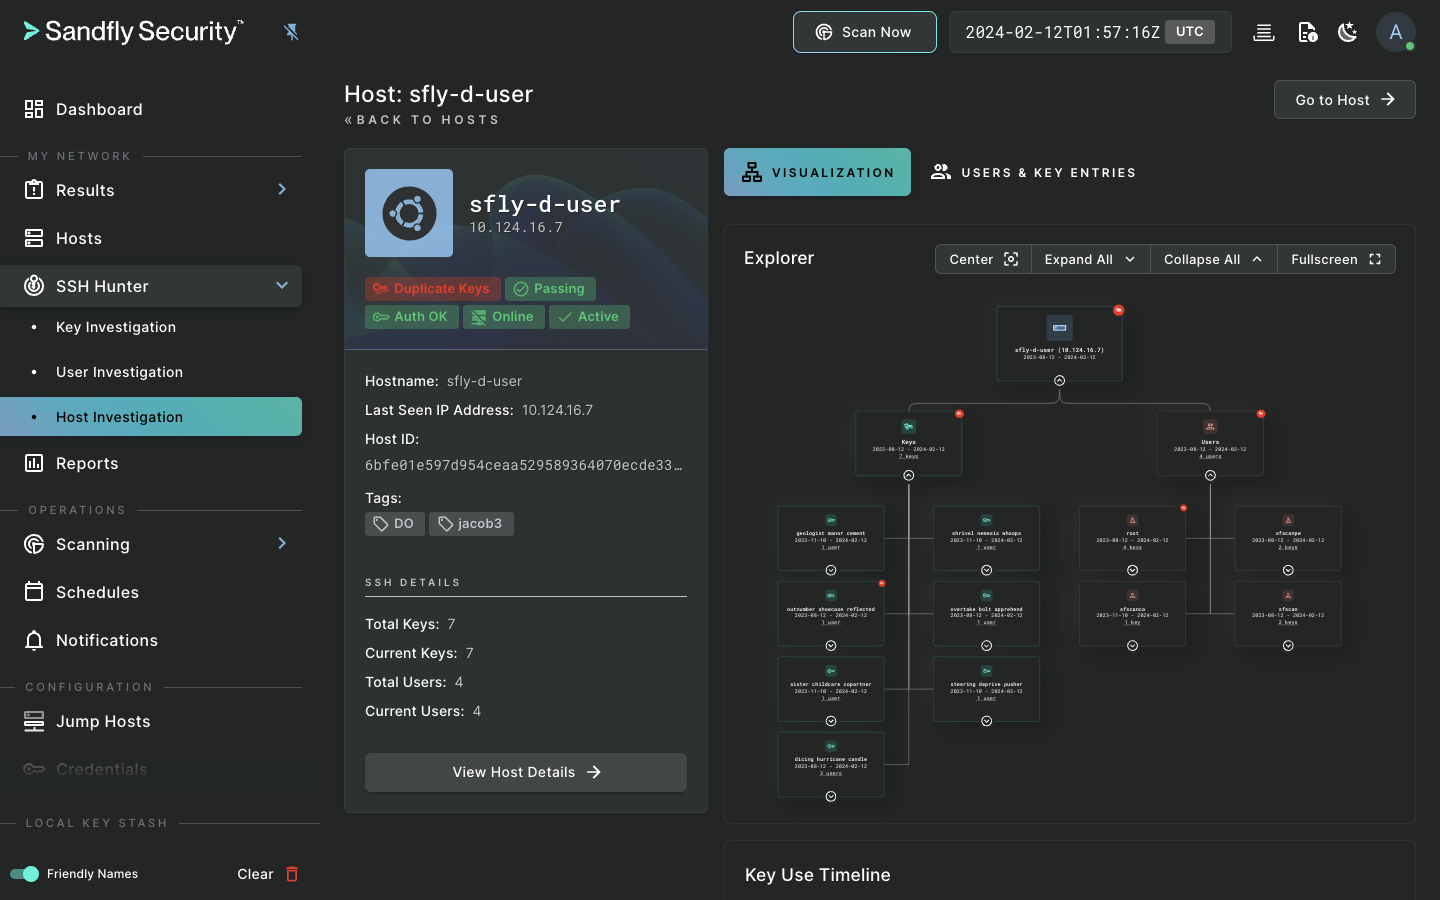
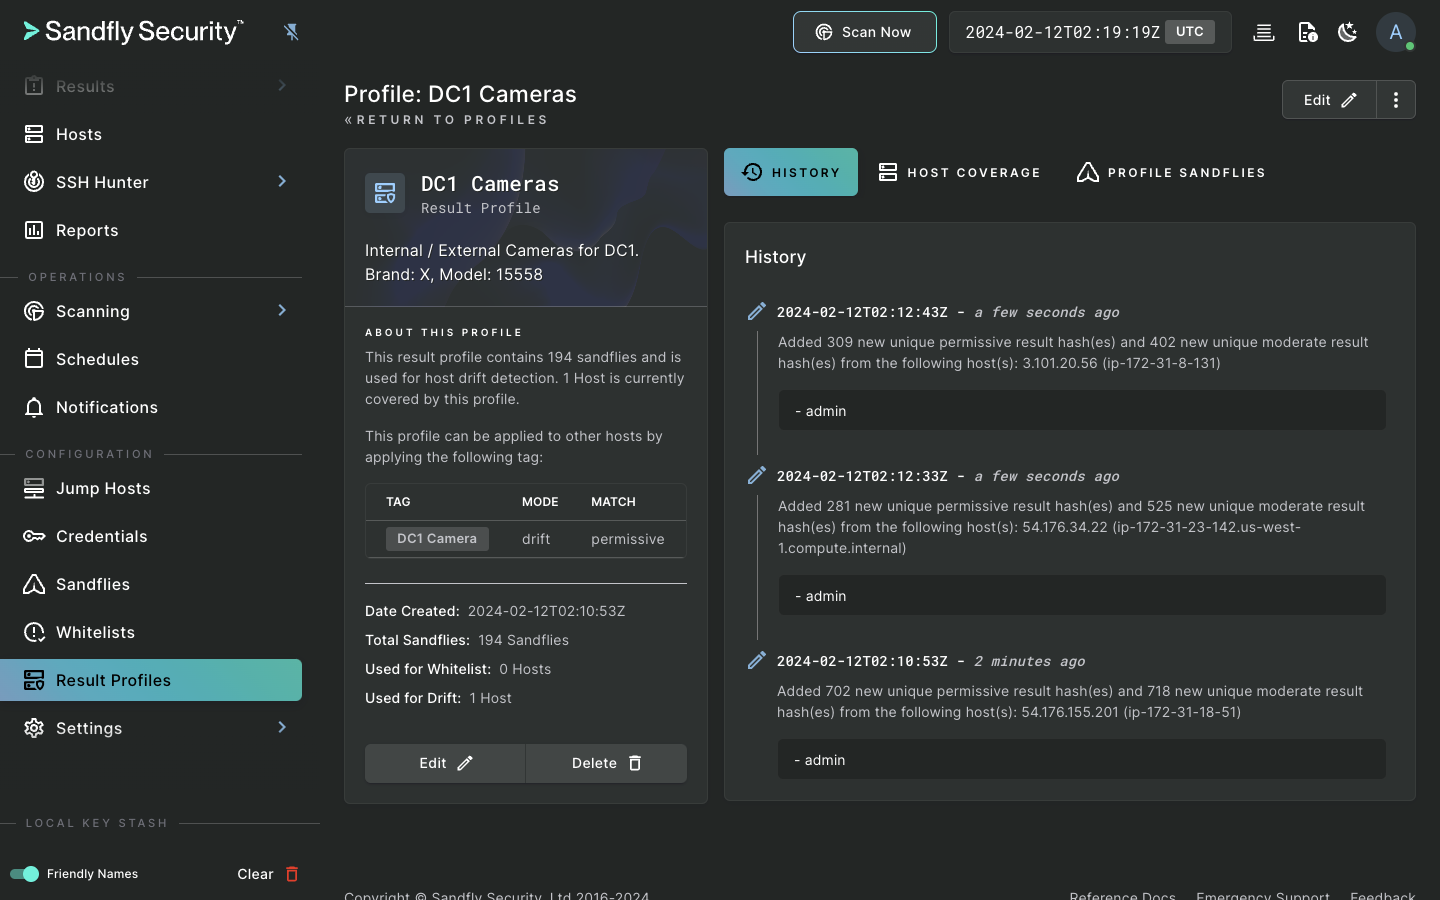
Besides traditional Endpoint Detection and Response (EDR) capabilities, Sandfly also tracks SSH credentials, audits for weak passwords, detects unauthorized changes with drift detection, and allows custom modules to find new and emerging threats. We do all of this with the utmost safety, performance, and compatibility on Linux. And, we do it without loading agents on your endpoints.

Compatible. Safe. Fast.
Sandfly excels in Linux threat detection in a safe and reliable way.
Widest compatibility
The widest coverage for Linux on the market. Sandfly protects most distributions and architectures such as AMD, Intel, Arm, MIPS and POWER CPUs.
02.→Proven safety
Sandfly is safe and will not impact critical infrastructure. We have a proven track-record of safety and performance in this role globally.
03.→Fastest deployment
Instantly deploys across all systems in seconds to get immediate visibility, monitoring, and incident response.